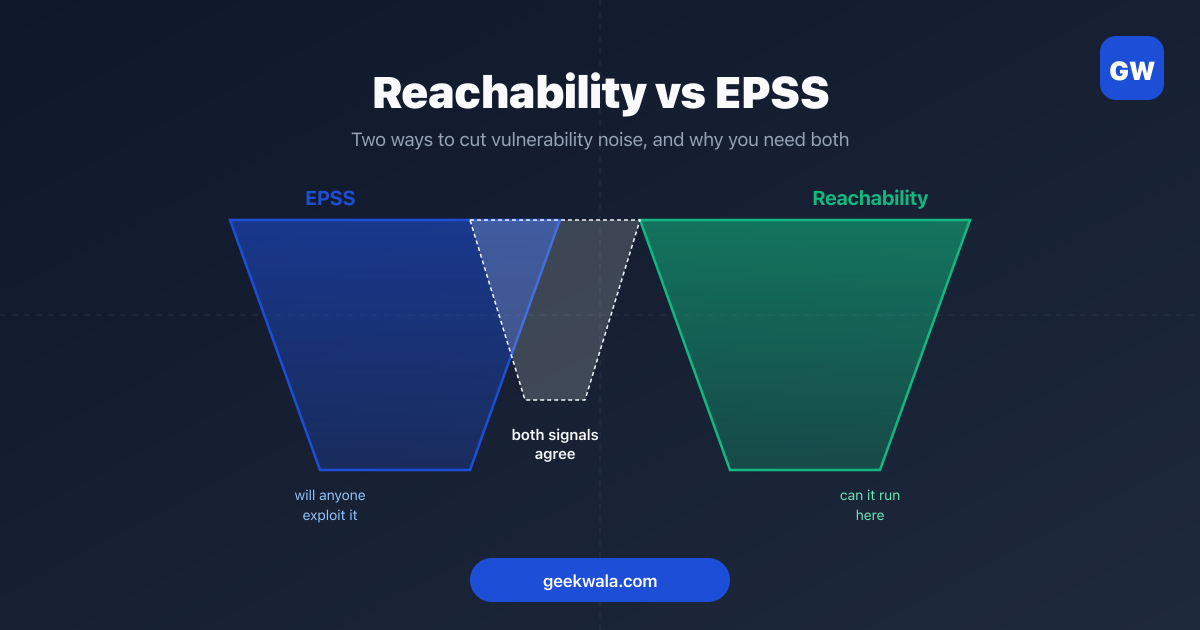
At most ~6% of published CVEs are ever exploited in the wild — stricter datasets put it nearer 1-2%. The other 94%+ generate scanner alerts and burn engineering time without ever being weaponized. EPSS and CISA KEV membership identify which few CVEs deserve urgent action; everything else can wait for routine maintenance.
Last updated: August 2026. This refresh corrected the sourcing table: an earlier version attributed a ~6% figure to Kenna Security/Cisco, whose own published estimate (Prioritization to Prediction Vol. 1) is nearer 2%. VulnCheck's ~1% tracking has been added, the CISA KEV ratio refreshed against current CVE volumes, and the "sources converge" framing replaced with the actual ~1–8% spread. The ~6% headline reflects the Jacobs/FIRST EPSS estimate and is the upper end of that range. See the section below on our illustrative Q2 2026 report for a worked example of how the split looks in practice.
Of the 355,000+ CVEs published to date, only a small single-digit percentage have ever been exploited in the wild — roughly 6% by the most generous published estimate, and closer to 1–2% by stricter ones. The overwhelming majority exist as database entries, scanner alerts, and Jira tickets — but never as actual attacks. The fix isn't to ignore vulnerabilities — it's to use EPSS and CISA KEV to identify the few percent that deserve urgent action and relegate the rest to routine maintenance, the approach the 3-Signal Triage Method formalizes.
That number comes from research by Jay Jacobs and the FIRST EPSS team analyzing exploitation data against the full CVE corpus — specifically 5.5% in their 2020 study (75,976 CVEs, 2009–2018) and 6.4% in the 2023 EPSS v3 paper (192,035 CVEs, through 2022). It is the upper end of a range: Kenna/Cyentia's enterprise telemetry put the figure nearer 2%, and VulnCheck's public-exploitation tracking nearer 1%. CISA's own Known Exploited Vulnerabilities catalog — the mandatory-remediation list established by Binding Operational Directive 22-01 — is the strictest floor of all, roughly 1,300 entries against 355,000+ published CVEs, under 0.4%.
The estimates differ because they measure different things: exploitation observed on enterprise networks, exploitation evidenced publicly anywhere, and exploitation confirmed by a government body are three progressively narrower questions. What every one of them agrees on is the shape of the answer — the exploited share is a small single-digit percentage at most, and the unexploited majority is overwhelming.
We ran our own 12-month audit of the KEV floor specifically for open-source dependencies, since the industry-wide ~0.4% figure above mixes in appliances and operating systems that this scanner doesn't touch. The dependency-only rate is even lower: just 0.19% of CVEs newly published across our 8 tracked ecosystems reached KEV in the window we measured, and only 10% of everything CISA added to KEV touches a package ecosystem at all — see our KEV exploitation research for the full breakdown, including how much advance warning EPSS actually gave before each of those listings.
The implications are uncomfortable: most vulnerability management effort is wasted on threats that never materialize.
The Numbers
The ~6% figure isn't a single data point — but nor is it a tight consensus. Published estimates span roughly 1% to 8% depending on the dataset and the framing, and ~6% sits at the upper end of that range rather than in the middle of it:
Source                              Exploitation Rate     Dataset
──────────────────────────────────────────────────────────────────────
Jacobs et al. 2020 study (arXiv)    5.5%                 n=75,976 CVEs, 2009-2018
Jacobs et al. 2023 (EPSS v3 paper)  6.4%                 n=192,035 CVEs, through 2022
Exploit-DB + Metasploit coverage    ~8%                  Public exploit code available
Kenna/Cyentia, P2P Vol. 1 (2019)    ~2%                  Enterprise exploitation telemetry
VulnCheck (decade aggregate;        ~1-1.1%              Public exploitation/KEV tracking
  2025 annual cohort)
CISA KEV catalog                    ~0.4% (confirmed)    Government-verified active exploitation
──────────────────────────────────────────────────────────────────────

Note: CISA KEV's ~0.4% is the floor — only CVEs with government-verified
evidence. Broader estimates run higher because they count exploitation
CISA hasn't cataloged. The spread between ~1% and ~8% is a difference in
what each dataset can observe, not a contradiction.
Even at the upper bound (~8% with public exploit code available), the vast majority of CVEs will never be weaponized. And having a public exploit doesn't mean it's being used in real attacks — it means someone could use it.
A note on the shorthand: for readability, the rest of this article says "6%" and "94%" rather than repeating the full range each time. Read those as the most generous exploitation estimate and its complement — the conservative end of the argument, not a precise measurement. Every stricter dataset makes the case for prioritization stronger, not weaker.
Why So Few CVEs Get Exploited
Not every vulnerability is worth an attacker's time. Exploitation requires effort — building or adapting exploit code, identifying targets, establishing infrastructure, evading detection. Attackers are rational actors who optimize for return on investment.
Attackers exploit CVEs that are:
- Easy to weaponize (public PoC code, simple attack vector)
- Widely deployed (popular frameworks, default configurations)
- High-value targets (authentication, data access, code execution)
- Unpatched at scale (slow enterprise patch cycles)
Attackers skip CVEs that are:
- Complex to exploit (multi-step, requires local access, specific configuration)
- Niche software (small install base = small target pool)
- Low-value outcomes (DoS on non-critical service, info disclosure of public data)
- Quickly patched (fast ecosystem response = shrinking target window)
This is why a CVSS 9.8 vulnerability in an obscure library might never be exploited while a CVSS 4.0 flaw in Express.js gets weaponized within days. CVSS measures the vulnerability's characteristics. Attackers optimize for opportunity.
What This Means for Your Team
The Alert Fatigue Math
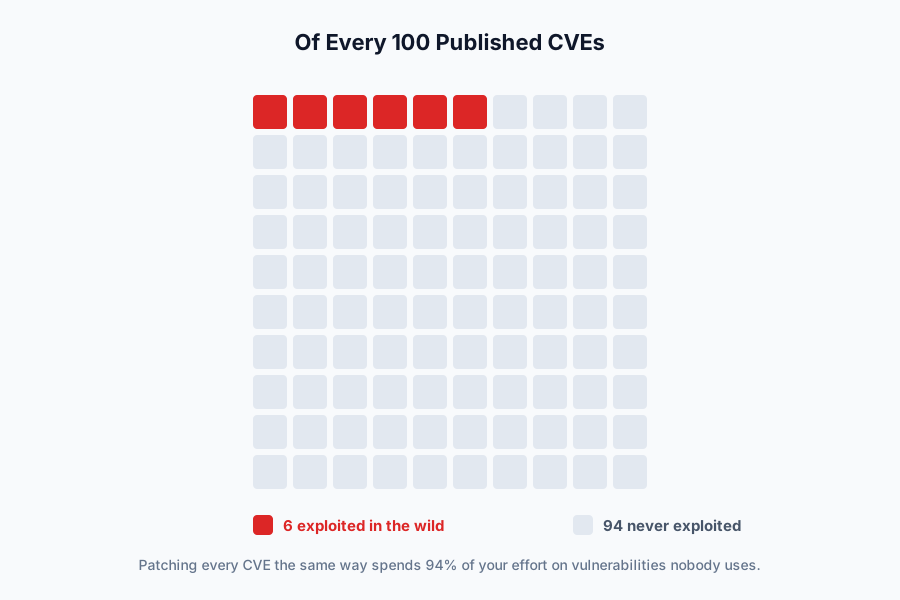
If your scanner reports 100 findings and 94 of them will never be exploited, you're dealing with a 94% noise rate. Your team is spending most of its security effort on non-threats.
Typical vulnerability scanner output:

  100 findings
   ├─ 94 will never be exploited     ← Your team patches these anyway
   └─  6 will actually be weaponized  ← These are the ones that matter

Without EPSS/KEV:  You treat all 100 as roughly equal priority
With EPSS/KEV:     You identify the 6 and handle them first
This isn't theoretical. Teams that adopt EPSS-based prioritization report patching effort reductions of 60-80% while maintaining or improving their security posture. They're not patching fewer vulnerabilities total — they're patching the right ones first.
The Cost of Treating Everything as Urgent
When everything is urgent, nothing is. The team that treats 100 findings as equally important will:
- Burn out engineers on low-risk patches
- Miss genuinely dangerous vulnerabilities buried in the noise
- Create organizational cynicism about security ("another 50 audit findings, sure")
- Slow feature development with constant context switching
The team that identifies the 6% first will:
- Patch the actually-dangerous vulnerabilities within hours
- Handle the rest during scheduled maintenance windows
- Maintain engineering velocity and team morale
- Build credibility by demonstrating that security priorities are data-driven
How to Identify the 6%
Two signals separate the 6% from the 94%:
EPSS (Exploit Prediction Scoring System) predicts which CVEs will be exploited in the next 30 days using machine learning trained on real threat intelligence. CVEs with EPSS above 0.1 are disproportionately likely to be in the exploited 6%.
CISA KEV (Known Exploited Vulnerabilities) confirms which CVEs are being actively exploited right now. Every KEV entry is definitionally in the 6%.
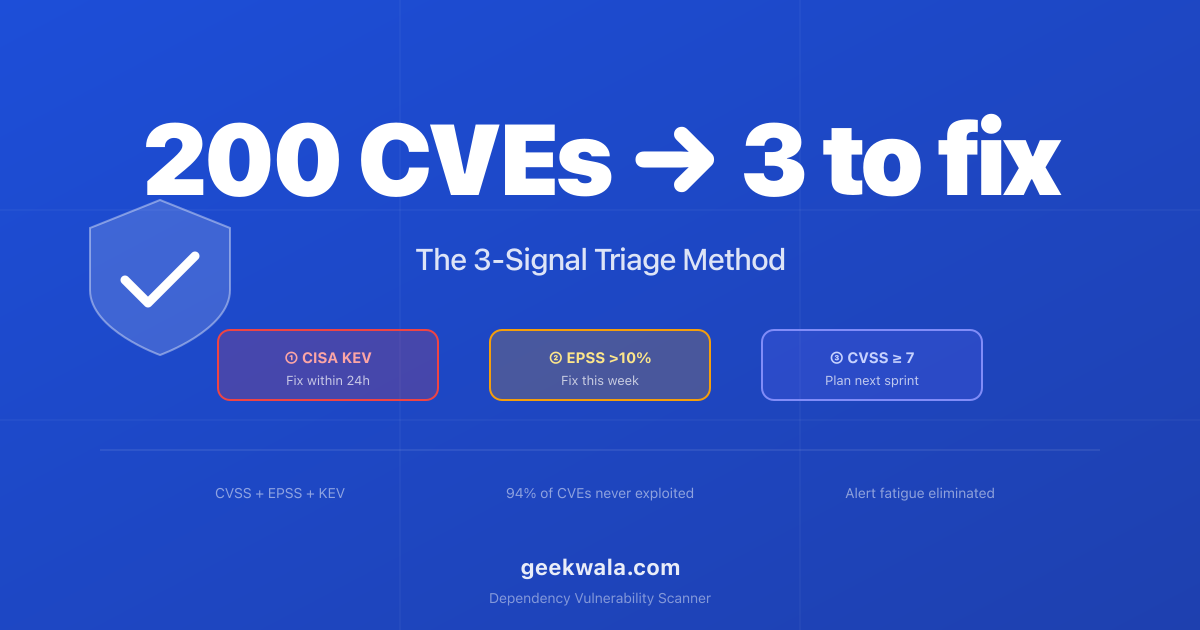
Together, they form the basis of the 3-Signal Triage Method: use CISA KEV as an override (patch immediately), EPSS as the primary sort key (highest exploitation probability first), and CVSS as a tiebreaker.
The 6% filter in practice, starting from 100 scanner findings (deadlines follow the default ladder in the guide):
- On CISA KEV: patch within 24 hours (confirmed exploited).
- EPSS above 0.9: patch within 24 hours.
- EPSS 0.7–0.9: patch within 1 week.
- EPSS 0.3–0.7: patch within 2 weeks (likely exploited).
- EPSS 0.1–0.3: patch within 30 days (elevated risk).
- EPSS below 0.1: routine maintenance (likely in the 94%).
2026 So Far: The Split Holds
The illustrative-format figures in GeekWala's own quarterly exploitation reports are directionally consistent with the aggregate figure rather than contradicting it — read as a worked example of the split, not independent statistical confirmation. Across March and Q2 2026, the illustrative KEV catalog additions total 26 entries (7 in March, 19 across April-June) against a background of hundreds of new advisories per month across npm, PyPI, Maven, and Go — a small, high-severity slice of a much larger advisory volume, the same shape as the ~6% split described above. A moving numerator against a large denominator is exactly what you'd expect quarter to quarter and doesn't change the underlying ~6% research finding, which is a multi-year aggregate from the sources cited above, not a monthly one.
The same illustrative reports also model a shrinking lag between a CVE crossing an EPSS threshold and its KEV listing (18 days in the March report's illustrative data, 14 days in Q2's). Treat that as a modelled scenario, not a measured CISA trend; for measured EPSS lead times before KEV listing, see GeekWala Research's KEV Exploitation 2026 report. Either way the practical point holds: EPSS is an early signal for the same triage this article describes, rather than something you learn only after KEV listing.
Frequently Asked Questions
Does "6%" mean I can ignore the other 94%?
No. It means you can deprioritize them. The 94% are still real vulnerabilities that deserve patching — just not at emergency priority. Patch them during scheduled maintenance, dependency update cycles, or quarterly security sweeps. The goal is to stop treating them with the same urgency as the 6% that are actually being weaponized.
Could a CVE in the 94% become part of the 6% later?
Absolutely. A CVE with EPSS 0.01 today can spike to 0.8 next week when a proof-of-concept is published. This is why regular re-scanning matters — EPSS updates daily, and the 3-Signal Triage Method catches these transitions. A vulnerability moves from the 94% to the 6% when threat actors start paying attention to it.
Is 6% the same across all ecosystems?
The overall rate is roughly consistent, but exploitation patterns vary by ecosystem. npm vulnerabilities in widely-used packages like Express have higher exploitation rates than niche Rust crates. The 6% is an aggregate — your specific ecosystem may be higher or lower, which is why per-CVE EPSS scores matter more than the aggregate statistic.
How does this relate to CVSS severity levels?
Poorly, which is the point. High-CVSS vulnerabilities are only slightly more likely to be exploited than medium-CVSS ones. Research shows CVSS 9.0+ vulnerabilities have roughly a 12% exploitation rate — better than average, but still meaning 88% of "Critical" findings are never exploited. EPSS is a far stronger predictor of actual exploitation than CVSS severity. For the full comparison of CVSS vs EPSS, see our head-to-head analysis.
Once you know which 6% to focus on, see What to Do When Your Scanner Finds 200 CVEs for the triage playbook that puts this data into action.
Find out which of your vulnerabilities are in the 6% that matter.
Scan your dependencies now → — every finding is enriched with EPSS exploitation probability and CISA KEV status so you can instantly separate the signal from the noise. No account needed.